8 Best SaaS Unicorn Performance Agencies to Accelerate Your Path to $1B
In our next installment of our Ad Words Reporting 101 series, we’re covering Hour of Day and Day of Week Analyses! These reports are excellent for optimizing accounts. Using the data you can adjust ad schedules so that your ads are only running during peak times for higher CTR and more conversions.

Why Are Hour of Day & Day of Week Analyses Important?
1. They Inform your clients, and keep them up to date on how their ads are performing at different times during the day and week.
2. They help make decisions. See when ads are most successful and adjust bids based on these observations.
3. The insights help to optimize. Ultimately, as certain ads are adjusted, optimize performance of the ads.
How to Do it
1. Download an Hour of Day/Day of Week report
2. Create a pivot table that sums impressions, clicks, cost, and conversions by hour/day.
3. Calculate CTR, CPC, CVR, and CPA for each.
4. Conditionally format and identify best and worst performing hours/days.
Full step-by-step process is below
Skills Required
1. Excel concatenate function
2. Excel calculation functions
3. Create a pivot table in Excel
4. Conditional and number formatting in excel
Note: The above are all explained in detail in our Essential SEM Excel Skills blog.
End products
Step-by-Step Process
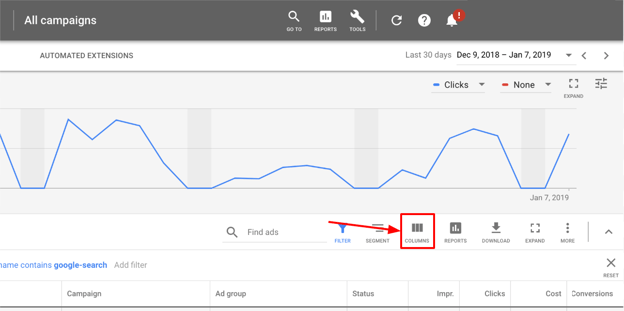
1. Download an Hour of Day or Day of Week report off Google Ads
Both the Hour of Day and Day of Week Reports are under the “Ad Schedule” tab on the left sidebar once you’ve clicked into an account:
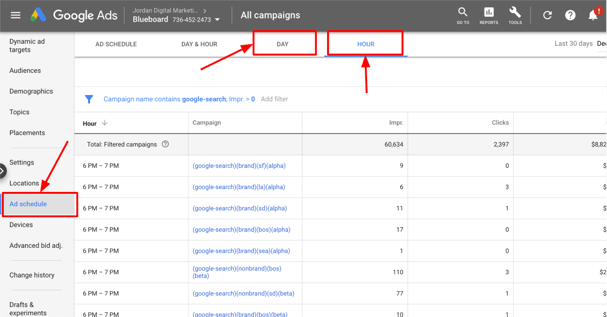
Next, set the filters by clicking into the bar that looks like this:

Filters:
- Campaign Name: contains “google-search”
- Impressions: >0
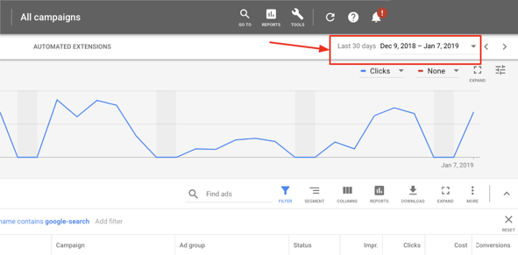
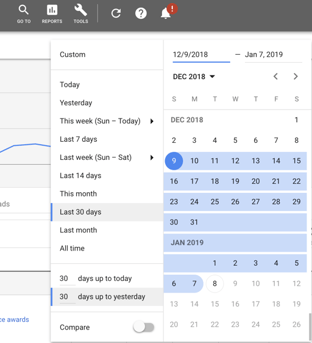
Date range:
- 30 days up to yesterday
Columns:
- Impressions
- Clicks
- Cost
- Conversions
2. Create a pivot table that sums impressions, clicks, cost, and conversions by hour/day
Create Pivot Table
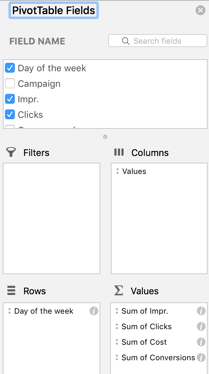
Select all raw data and insert a pivot table in a new tab. Once your sheet is selected, click in the “Insert” tab in Excel and select “PivotTable”.
Drag the hour/day field in the “rows” pivot section and the impressions, cost, clicks, and conversions into the “value” field.
Copy to a New Tab
On a new tab, remove all lines by selecting the entire sheet and hitting the white color under the paint bucket. This is to make the sheet look more presentable for clients.
Copy the pivot table, excluding the grand total row. Next, right click in the new tab you created and select “Paste Special” and then “Values”. Right-click again and hit “Paste Special” and “Format”.
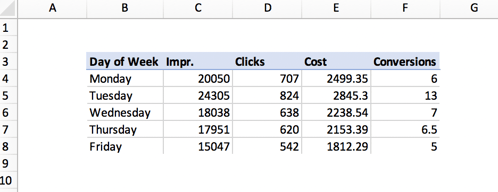
Remove “Sum of ” from the headers with the find and replace function so that you have something that looks like this:
3. Calculate CTR, CPC, CVR, and CPA for each hour/day and format numbers in fields
Insert CTR, CPC, CVR, CPA Rows
Insert a row before cost, before conversions, and 2 after conversions labeled respectively: CTR, CPC, CVR, CPA.
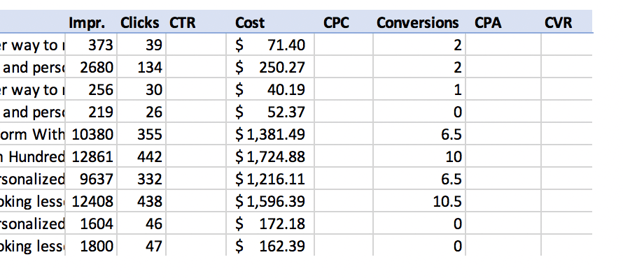
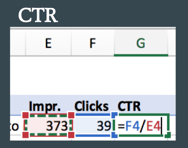
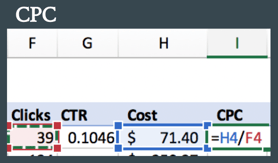
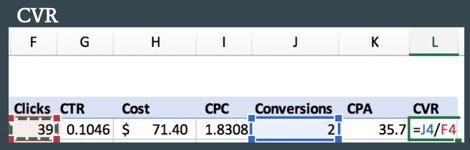
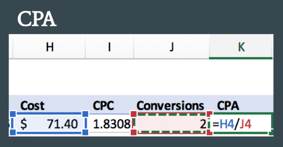
Calculate CTR, CPC, CVR, CPA
Using a formula, calculate the CTR (clicks/impressions), CPC (cost/click), CVR (conversions/click), and CPA (cost/conversion) of each hour/day.
TIP. If you get errors because you are dividing by 0, wrap your calculation with the IFERROR function
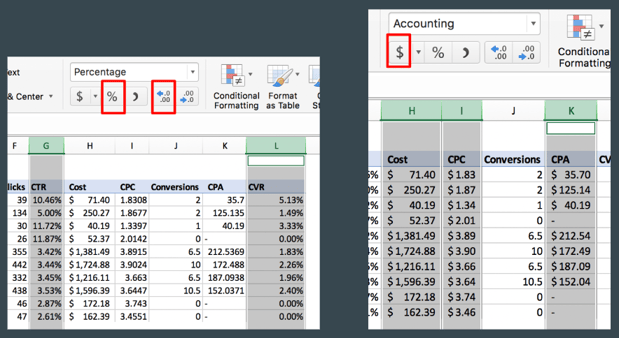
Format Numbers
Format all rates to the % format with two digits after the decimal point and all dollars to the $ format.
4. Conditionally format fields and analyze
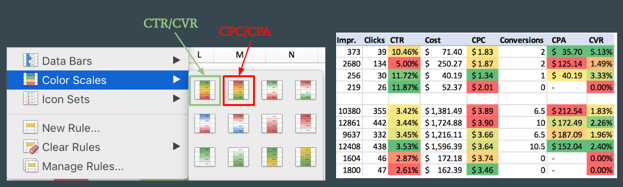
Conditionally Format
Add color scales to the CTR, CPC, CVR, and CPA columns by using the conditional format option in the Home tab in excel. CTR and CVR are scaled with larger numbers in green and CPC and CPA scaled with larger numbers in red.
Identify best and worst performing ads
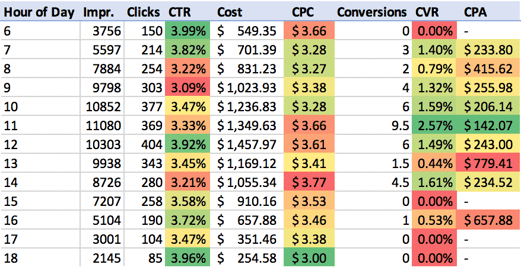
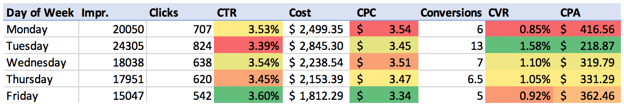
Best Performance: Identify which hour or day has the best overall performance: high CTR/CVR and low CPC/CPA.
![]()
Worst Performance: Identify which hour or day has the worst overall performance: low CTR/CVR and high CPC/CPA.
![]()
Present to Client: Either present the high level summary of the best and worst performing ads to the client directly, or convey the information to the account manager succinctly so they can easily communicate the report to their contacts.
Filtering By Category: You can filter your pivot table by campaign or category. To filter by campaign, pull the campaign field into the “filters” box when editing the pivot table.

To filter by category, first isolate the category from the campaign name in the raw data by using the find and replace function. Then, pull the new category field into the filters box when editing the pivot table.
Using these analyses, we hope your team will be able to optimize your accounts and make data-driven decisions. If you'd like to see if Jordan Digital Marketing could help with your Paid Search campaign, drop us a line!