


8 Best SaaS Unicorn Performance Agencies to Accelerate Your Path to $1B
Next up on our Ad Words Reporting 101 series: how to run a Geo Analysis. It’s important to run a Geo Analysis to determine which locales are performing the best for your ads and optimize accordingly.
Why?
INFORM. Keep clients up to date on which geos are performing best and worst.
DECIDE. Determine action plans based on observations.
OPTIMIZE. Ultimately optimize account performance.
How?
1. Download a user locations report off Google Ads
2. Create pivot tables and calculate CTR, CPC, CPA, and CVR
3. Conditionally format and highlight top and poor performers
Skills
1. Excel calculation functions
2. Create a pivot table in Excel
3. Conditional and number formatting in excel
4. Excel text to column feature
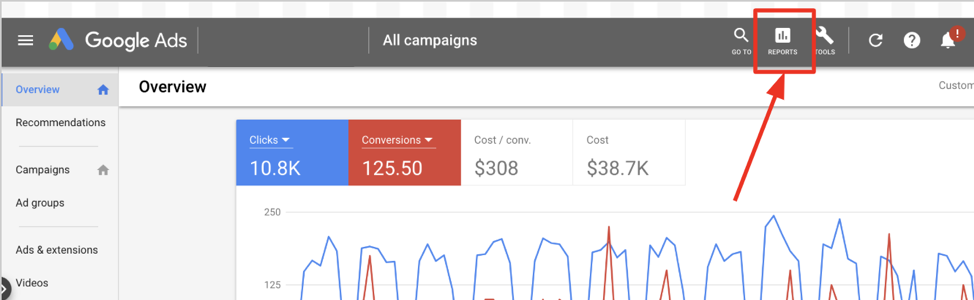
1. Download a user location report off Google Ads
Download report from predefined reports:
Filters:
- Dates: last 30 days up to yesterday
- Campaign name contains “google-search”
- Ad Status: all but removed
Columns:
- Campaign (you need to add this column in this type of report)
- Impressions
- Clicks
- Cost
- Conversions
2. Create a pivot table that sums impressions, clicks, cost, and conversions
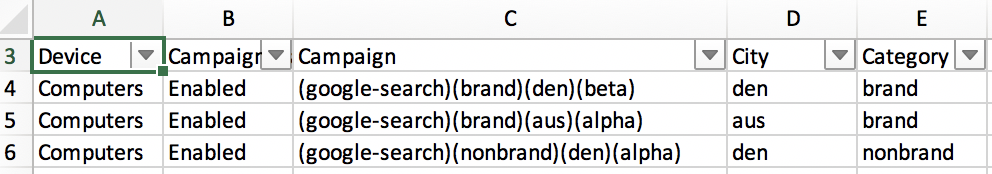
Modify the report:
ISOLATE GEO. Create a column called “city” or “geo” and copy the campaigns into that column. Use the find and replace tool in excel to isolate the geo in the campaign so that it is the only text in the geo column.
ISOLATE CATEGORY. Create a column called “category” and copy the campaigns into that column. Repeat what you did in the previous step but this time isolating the category. Use the find and replace tool in excel so that category is the only text in the category column.
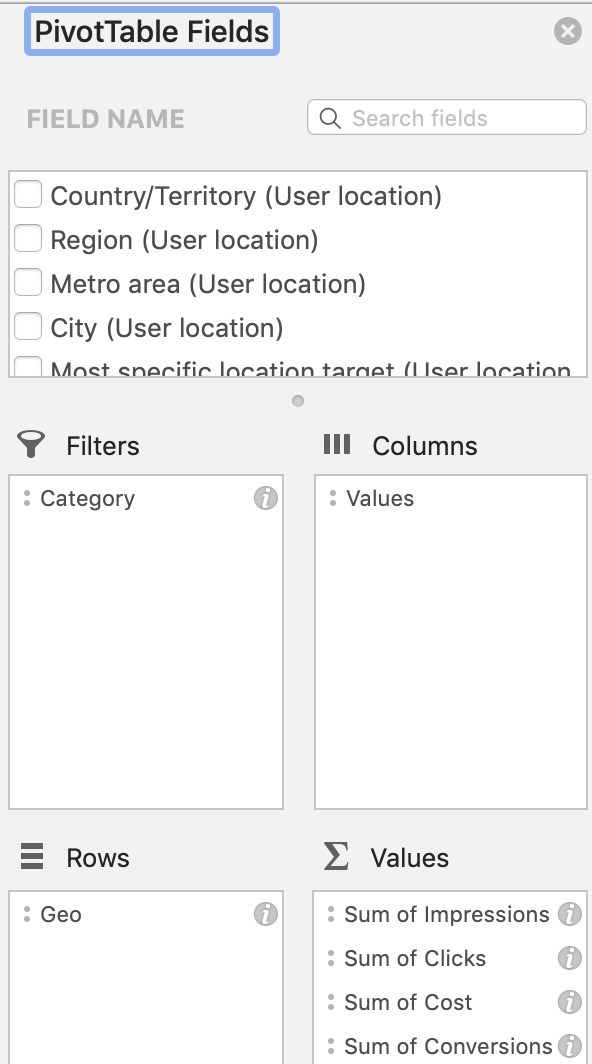
Pivot Table:
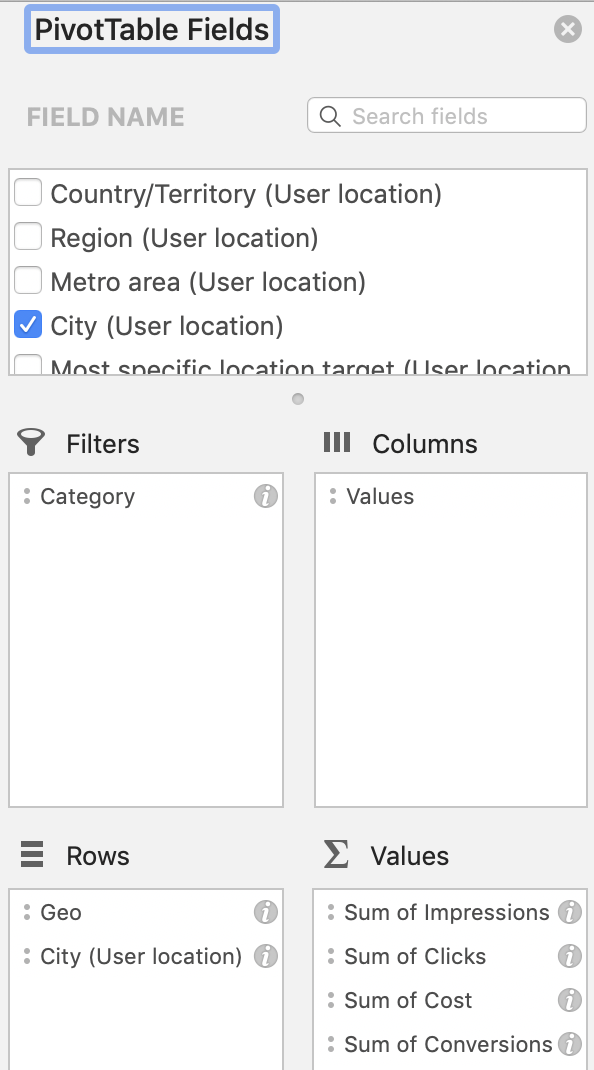
CREATE TOTALS PIVOT TABLE. Select all raw data and insert a pivot table in a new tab. First, pull the “geo” field in the “rows” pivot section, the “category” field in the filters section, and the impressions, cost, clicks, and conversions into the “value” field.
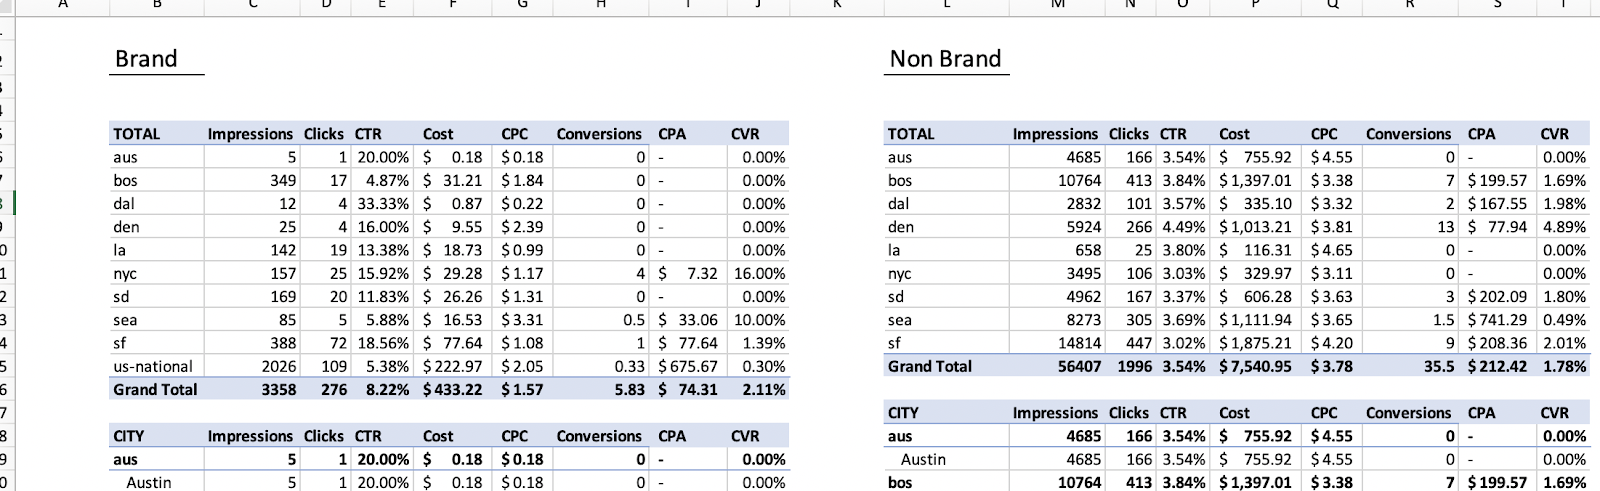
COPY TO A NEW TAB. On a new tab, remove all lines by selecting the entire sheet and hitting the white color under the paint bucket. Filter by category and for each one, copy the pivot table, including the grand total row and paste values, then paste format in the new tab. Add headers to indicate which category each table belongs to.
REPEAT WITH CITY INFO. Go back to the pivot table and pull “city” into the rows section of the pivot table, below “geo”. Filtering for each category, copy this table under the first geo table in the new tab you created in the previous step.
REMOVE “SUM OF ”. Use the “find and replace” tool to remove all the “sum of ” text in the three tables. For example, “sum of impressions” will display as “impressions.”
NAME EACH TABLE. In each table, use the cell that says “Rows” in the top right to label the table. The first is called “TOTAL”, the second is called “CITY”.
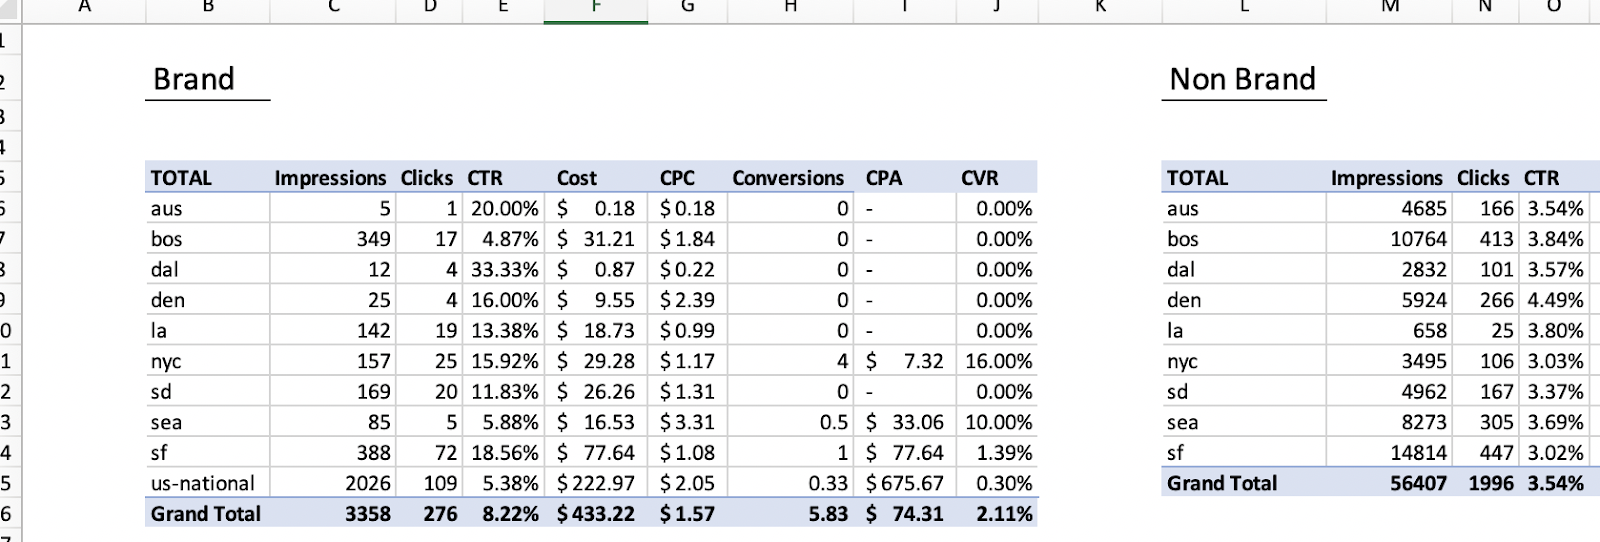
3. Calculate CTR, CPC, CVR, and CPA for each ad and conditionally format these fields
|
⏰ 14:44 |
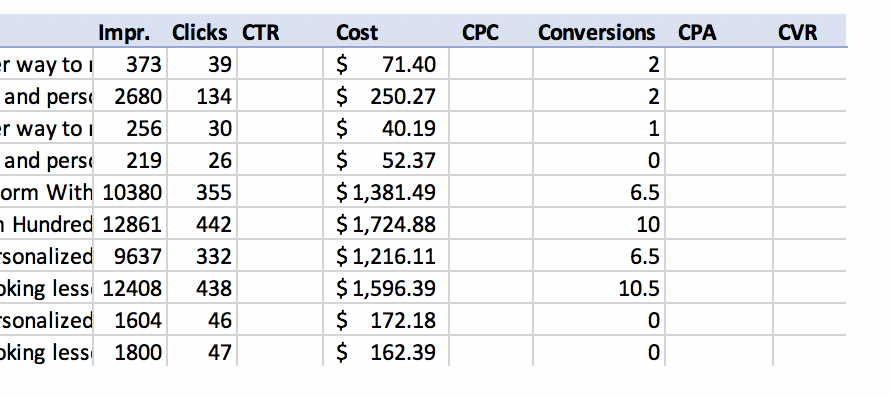
INSERT CTR, CPC, CVR, CPA ROWS. Insert a row before cost, before conversions, and 2 after conversions labeled respectively: CTR, CPC, CVR, CPA.
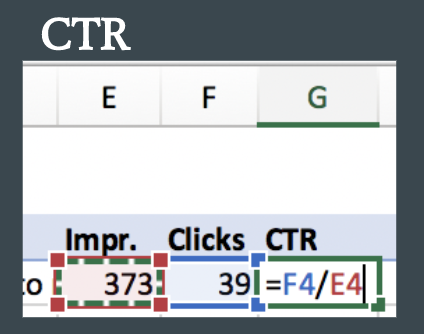
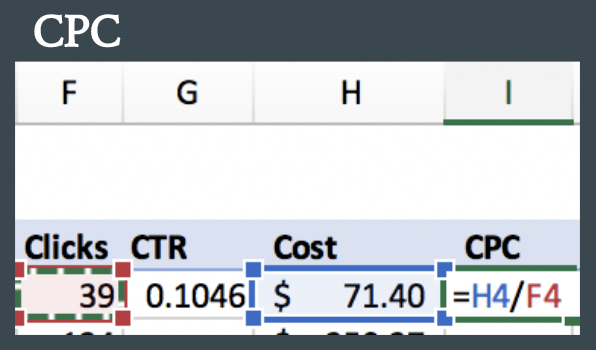
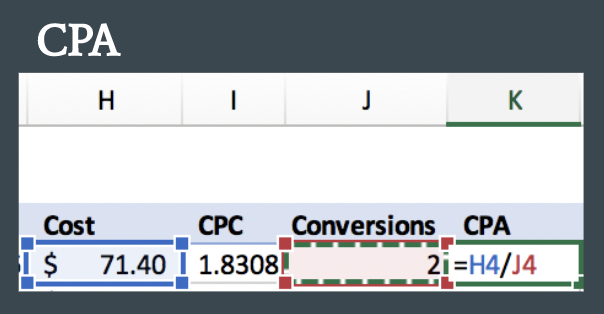
CALCULATE CTR, CPC, CVR, CPA. Using a formula, calculate the CTR (clicks/impressions), CPC (cost/click), CVR (conversions/click), and CPA (cost/conversion) of each device.
TIP. If you get errors because you are dividing by 0, wrap your calculation with the IFERROR function
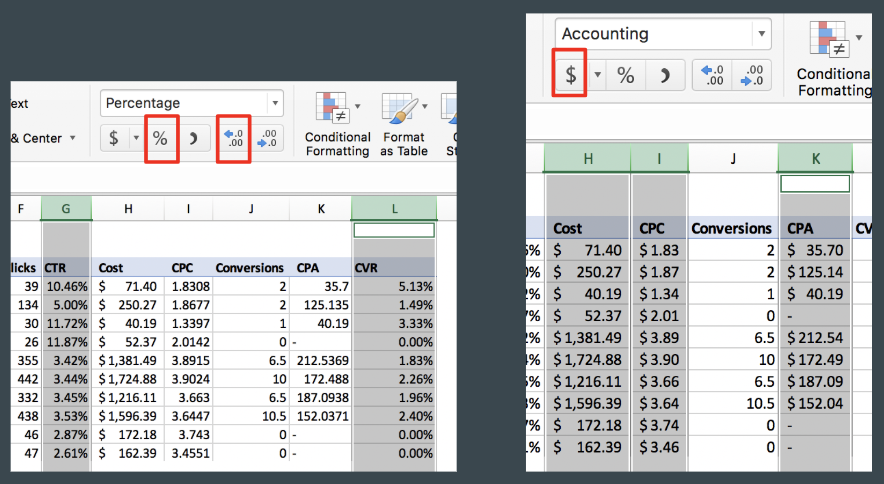
FORMAT NUMBERS. Format all rates to the % format with two digits after the decimal point and all dollars to the $ format.
CONDITIONALLY FORMAT. Add color scales to the CTR, CPC, CVR, and CPA columns by using the conditional format option in the Home tab in excel. CTR and CVR are scaled with larger numbers in green and CPC and CPA scaled with larger numbers in red.
Identify best and worst performing ads
BEST PERFORMANCE. In the city table, identify which 10 cities have the best overall performance: high CTR/CVR and low CPC/CPA.
WORST PERFORMANCE. In the city table, identify which 10 cities have the worst overall performance: low CTR/CVR and high CPC/CPA.
COPY TO TOP OF SHEET. Pull the top and worst 10 city performers and display them at the top of the sheet.


