


8 Best SaaS Unicorn Performance Agencies to Accelerate Your Path to $1B
Next up on our Ad Words Reporting 101 series: Device Analysis! These reports can be handy when deciding which platforms your ads should show on. It’s important to run reports like these occasionally because you never know when you might be surprised by the performance (or lack thereof) of ads on specific devices. Let’s dive in:
Why?
INFORM. Keep clients up to date on how their ads are performing on computers, mobile phones, and tablets.
DECIDE. Observe which devices are most and least successful and determine action plans.
OPTIMIZE. Ultimately, as devices are analyzed, optimize account performance.
How?
1. Download a 30-day campaign report off Google Ads
2. Create a pivot table that sums impressions, clicks, cost, and conversions by device.
3. Calculate CTR, CPC, CVR, and CPA for each ad and conditionally format these fields
4. Identify best and worst performing ads
5. Repeat with a 90-day campaign report
Skills
1. Excel calculation functions
2. Create a pivot table in Excel
3. Conditional and number formatting in excel
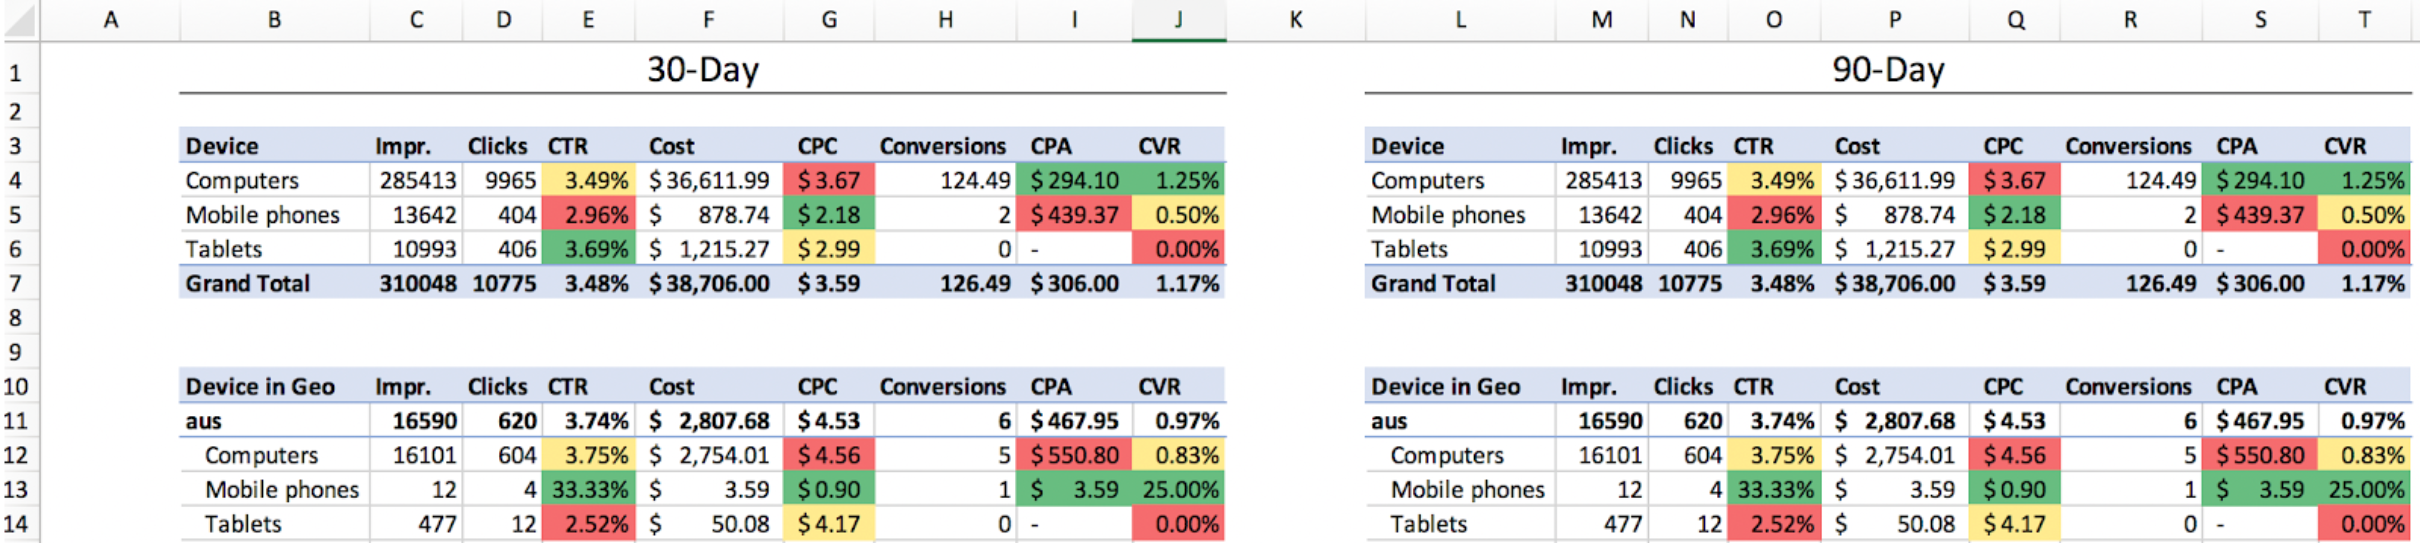
End product:
Directions
1. Download a campaign report off Google Ads
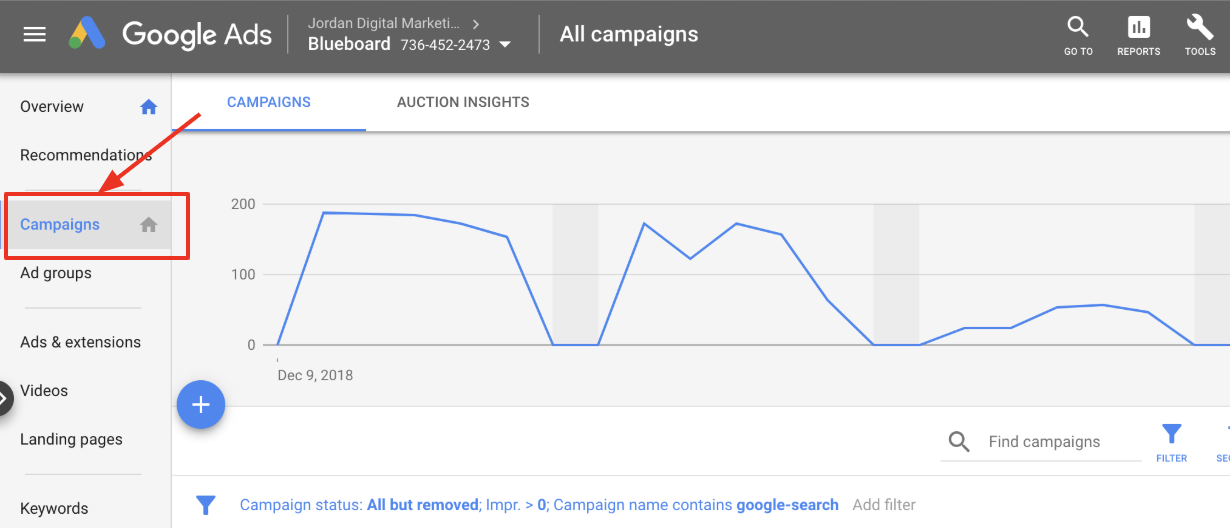
In Google Ads, click under the account you are working with and then hit the “Campaigns” tab in the left bar:
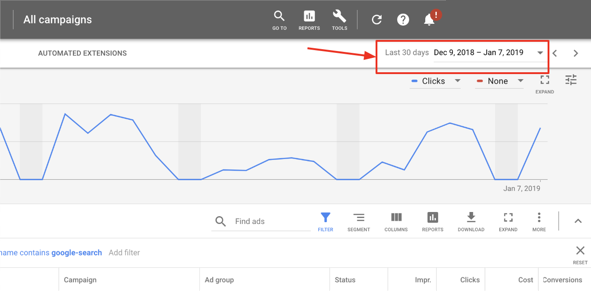
Next, set the filters by clicking into the bar that looks like this:
Filters:
- Campaign Name: contains “google-search”
- Impressions: >0
- Ad Status: all
Date range:
- 30 days up to yesterday
Columns:
- Impressions
- Clicks
- Cost
- Conversions
Segment:
- Device
2. Modify the report and create a pivot table that sums impressions, clicks, cost, and conversions by ad
Modify the report:
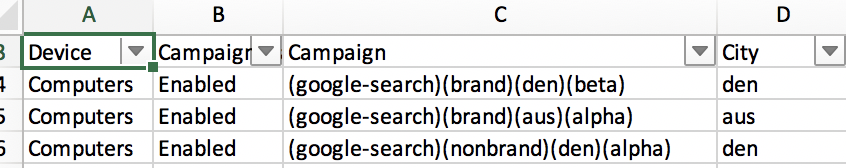
ISOLATE GEO. Create a column called “city” and copy the campaigns into that column. Use the find and replace tool in excel to isolate the geo in the campaign so that it is the only text in the geo column.
ISOLATE CATEGORY. Create a column called “category” and copy the campaigns into that column. Repeat what you did in the previous step but this time isolating the category. Use the find and replace tool in excel so that category is the only text in the category column.
Pivot Table:
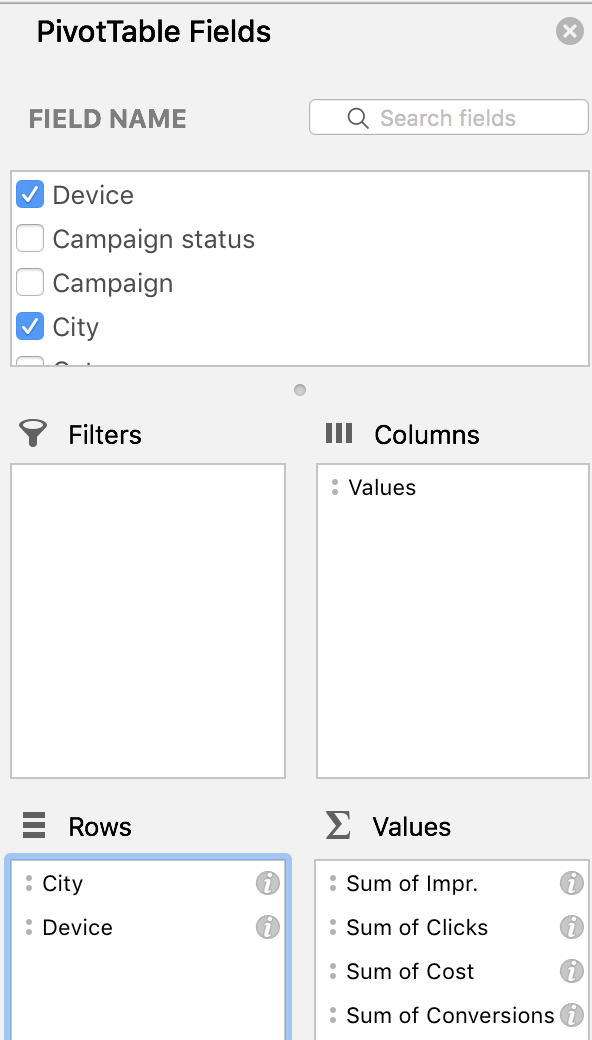
CREATE PIVOT TABLE. Select all raw data and insert a pivot table in a new tab. Go to the “insert” tab in Excel and hit “PivotTable”.
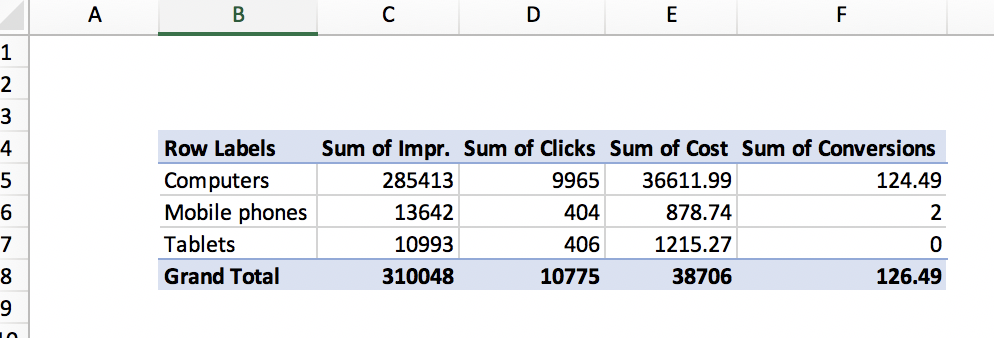
First, drag the “Device” field in the “rows” pivot section and then the impressions, cost, clicks, and conversions into the “value” field.
COPY TO A NEW TAB. On a new tab, remove all lines by selecting the entire sheet and hitting the white color under the paint bucket. This makes the sheet presentable to clients.
Next, copy the pivot table, excluding the grand total row. Paste the table in the new tab by right-clicking and selecting “Paste Special” and paste values only. Next, right clicking on the same cell, hit “Paste Special” and select paste format.
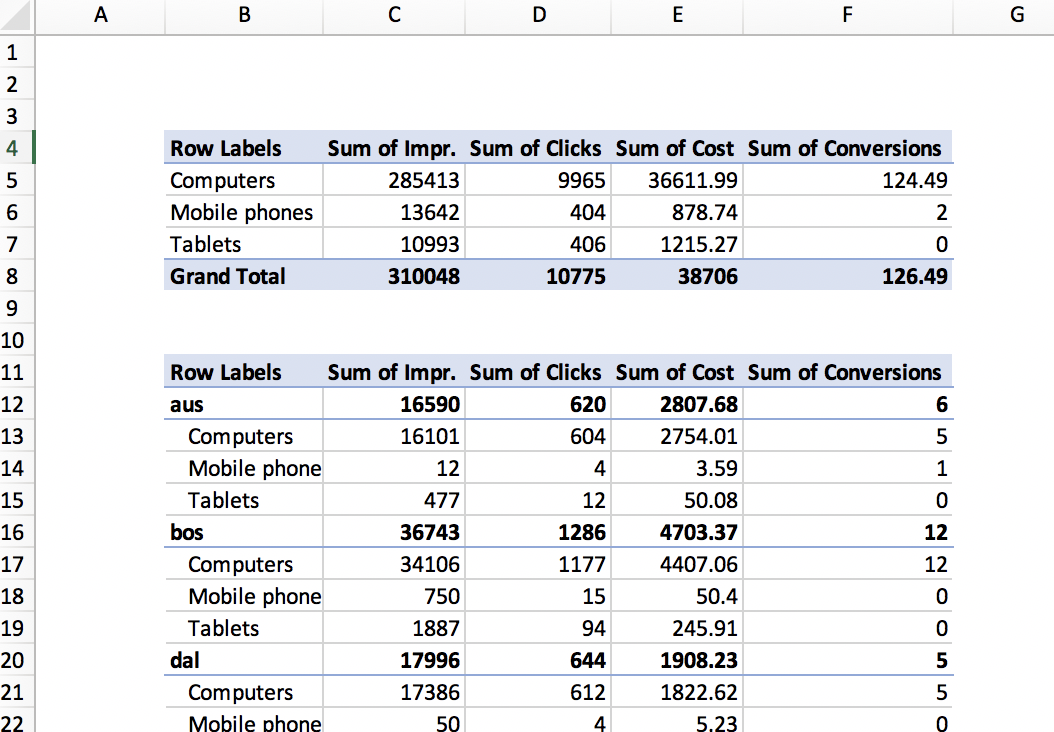
REPEAT WITH GEO INFO. Go back to the pivot table and pull “city” into the rows section of the pivot table, above “device”. Copy and paste this table under the first device table in the new tab you created in the previous step.
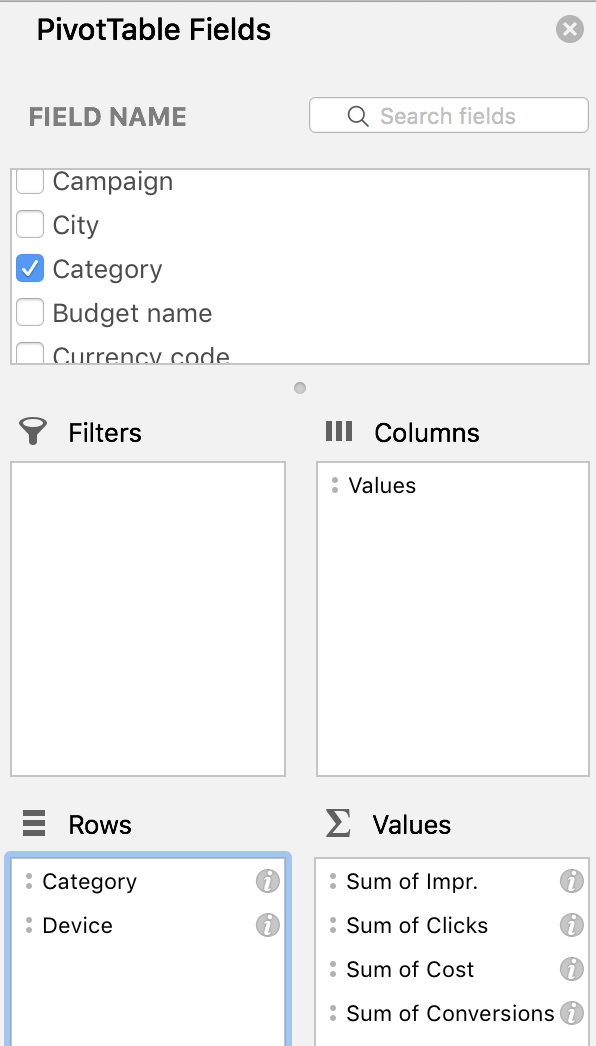
REPEAT WITH CATEGORY INFO. Go back to the pivot table and pull “category” into the rows section of the pivot table, above “device” and remove the “city” field. Copy and paste this table under the two tables already pasted in the new tab you created.
3. Calculate CTR, CPC, CVR, and CPA for each ad and conditionally format these fields
|
⏰ 11:33 |
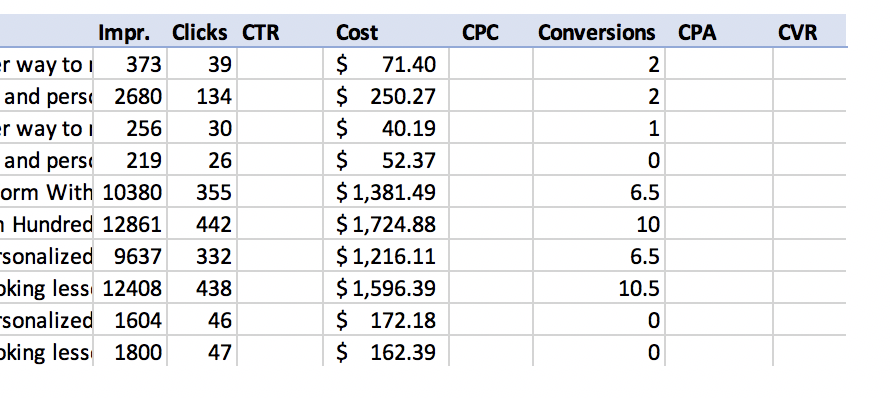
INSERT CTR, CPC, CVR, CPA ROWS. Insert a row before cost, before conversions, and 2 after conversions labeled respectively: CTR, CPC, CVR, CPA.
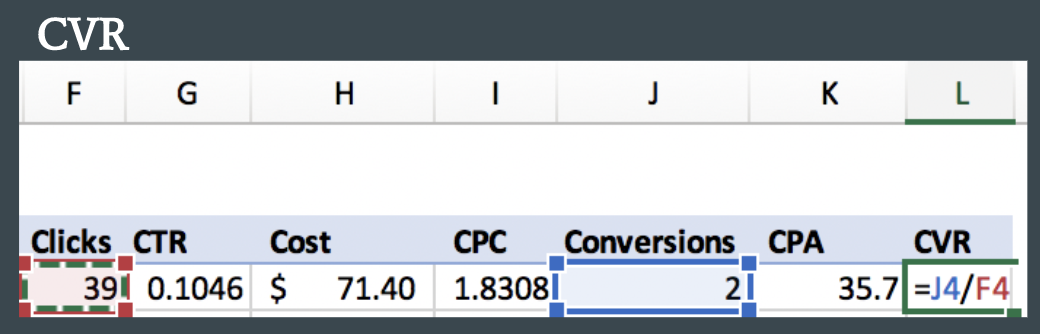
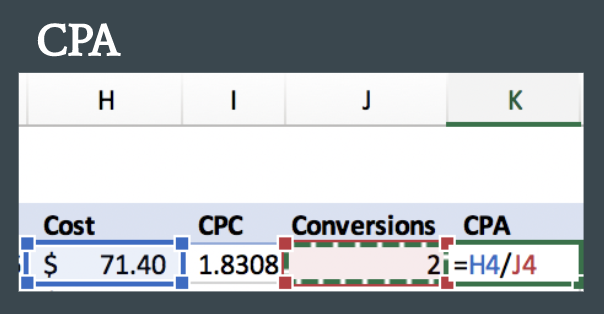
CALCULATE CTR, CPC, CVR, CPA. Using a formula, calculate the CTR (clicks/impressions), CPC (cost/click), CVR (conversions/click), and CPA (cost/conversion) of each device.
TIP. If you get errors because you are dividing by 0, wrap your calculation with the IFERROR function
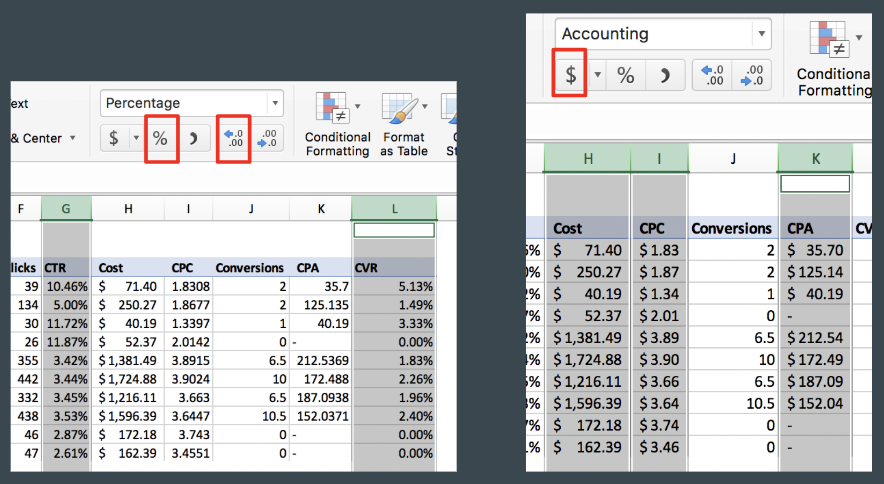
FORMAT NUMBERS. Format all rates to the % format with two digits after the decimal point and all dollars to the $ format.
NAME EACH TABLE. In each table, use the cell that says “Rows” in the top right to label the table. The first is called “Device”, then “device in geo”, and “device in category”.
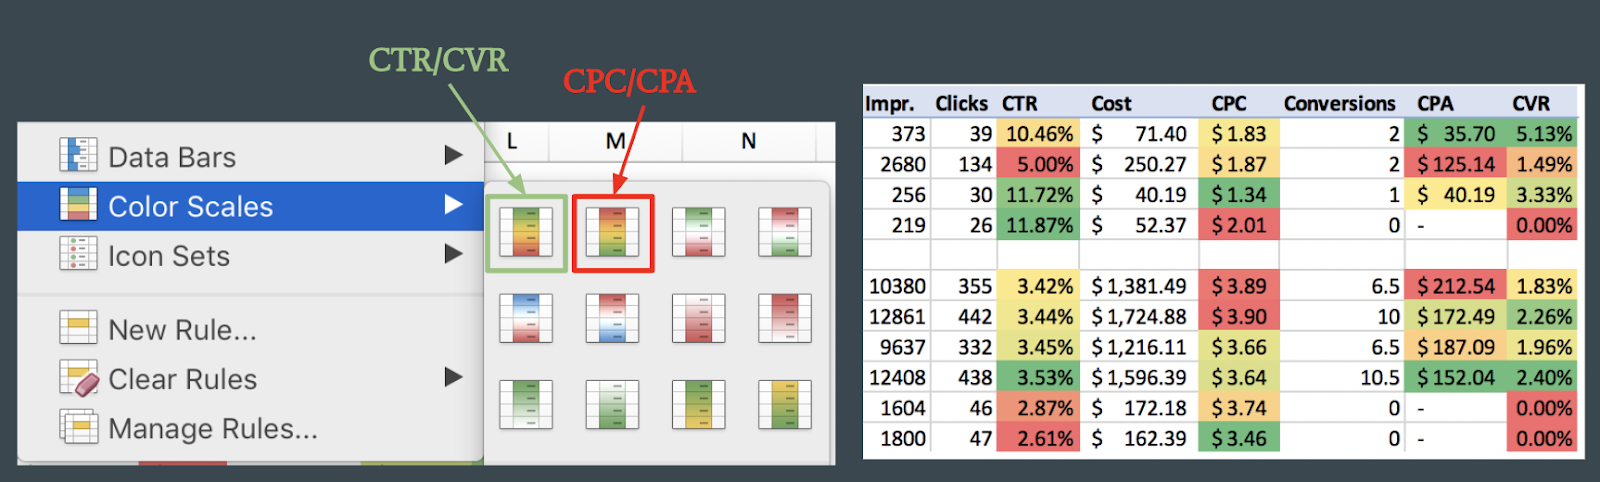
CONDITIONALLY FORMAT. Add color scales to the CTR, CPC, CVR, and CPA columns by using the conditional format option in the Home tab in excel. CTR and CVR are scaled with larger numbers in green and CPC and CPA scaled with larger numbers in red.
Identify best and worst performing ads
BEST PERFORMANCE. For each device, identify which has the best overall performance: high CTR/CVR and low CPC/CPA.
WORST PERFORMANCE. For each category, identify which ad has the worst overall performance: low CTR/CVR and high CPC/CPA.
PRESENT TO CLIENT. Either present the high level summary of the best and worst performing ads to the client directly, or convey the information to the account manager succinctly so they can easily communicate the report to their contacts.
4. Repeat with a 90 day report
REPEAT. Repeat all the above steps but start by pulling a 90-day report from Google Ads instead of a 30-day report.
COMPARISON. Put the 30-day and 90-day reports side by side in the new tab with headers. The final product should look something like this:
If you have any questions, or would like help in setting up your Device Analysis, contact the Paid Ad experts at Jordan Digital Marketing!


