


Adriana Mendez - JDM Impressions
Quality score is the key to a cost-effective search advertising campaign and maximizing return on ad spend (ROAS). Unfortunately, for such an important metric, the Google Ads UI is very limited in the data that it provides and the tracking options available.
Why is Quality Score Important?
Quality score is a rating based on how relevant your ads and landing pages are to your keywords. Google uses quality score along with other factors like your bid and ad extension data to determine ad rank.
A boost in quality score will result in one of the following:
- Increase in average ad position.
- Decrease in cost-per-click (CPC).
- Both an increase in average ad position and a decrease in CPC.
Quality Score Components
Quality score is determined by three main factors: ad relevance, landing page experience, and expected click-through-rate (CTR).
1. Ad relevance
Estimates how closely the message in the ad copy matches the keywords within the ad group.
2. Landing page experience
Measures how relevant the content on the landing page is to the users search term, keywords, and ad copy.
3. Expected CTR
Uses historical data to measure how likely it is that your ad will be clicked when shown.
Tracking Quality Score
One of the most common complaints I hear about quality score is that it’s difficult for advertisers to measure the effectiveness of their optimization efforts. This frustration is in large part due to the lack of options the Google Ads UI has available for tracking quality score.
You can check the quality score of keywords on a specific date, but what if you want to track the change in quality score over time?
In 2006, Martin Roettgerding developed a great script that gave advertisers the ability to track quality score on a daily basis. Developers at Clicteq then enhanced the script further by allowing advertisers to track the individual components of quality score over time.
With this script, you’ll gain valuable insight into whether or not your optimization efforts are paying off.
How to Implement the Quality Score Script
To get started, we first need a Google sheet to store the data.
Step 1:
Create a new Google sheet in a folder on your Google Drive.
Step 2:
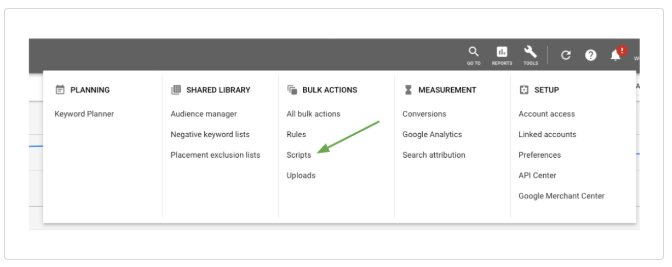
Navigate to the Tools & Settings menu within the Google Ads account. Under Bulk Actions, select Scripts.
Step 3:
Click the blue icon to add a new script to the account.
Step 4:
Download the script here.
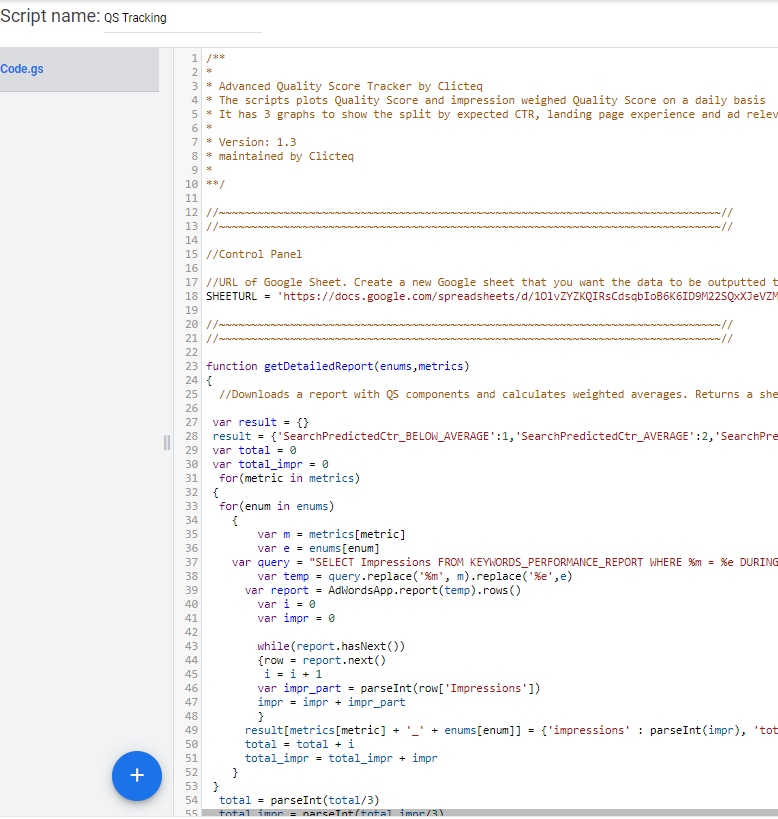
Step 5:
Copy and paste the script into the account. You should end up with something that looks like this.
Now we need to connect our script to the Google sheet we created.
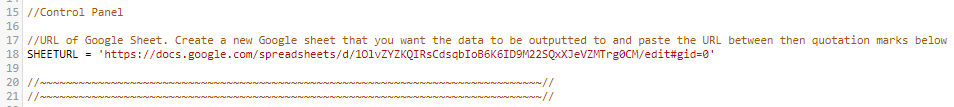
Step 5:
Paste the URL of the Google sheet you created into line 17 of the script. When the script runs it will send the data to this Google sheet.
Step 6:
Click Run.
The script will run each day and update the Google sheet. Now, you’ll be able to track high-level quality score data as well as each component that makes up quality score on a daily basis.
Identifying Quality Score Problems
Investigating and fixing quality score issues can improve account performance and reduce your CPCs, but there are a few things to keep in mind when thinking about quality score.
- If you build a strong account structure from the start with tightly themed ad groups and compelling ad copy that closely matches your keywords, quality score shouldn’t be a problem.
- Your account goals should always reflect your business goals. Only spend time and capital on quality score if it will help you achieve your business goals.
- Don’t obsess over quality score at the expense of other more important metrics.
Now that we got that out of the way, a great method to analyze quality score issues at the keyword level is to export a search keyword report and turn it into a quality score report by using some conditional formatting. Let’s get started!
Step 1:
Login to your Google Ads account and navigate down to the keyword level within the campaign and ad groups you want to analyze. Set the date range you’re interested in.
We only want to include the metrics we need for our quality score report.
Step 2:
Select Columns > Modify Columns. We want to modify our columns so that it only includes the following metrics:
- Clicks
- Impressions
- Quality score
- Landing page exp.
- Exp. CTR
- Ad relevance
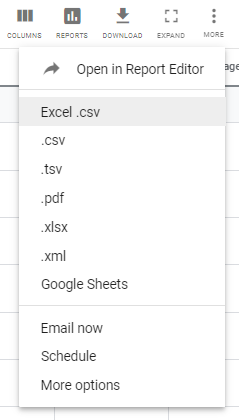
Step 3:
Download the search keyword report as an Excel .csv file.
Step 4:
Open the Search Keyword Report in Excel.
Let’s clean up the report a bit by removing rows and columns we don’t need.
Step 5:
Remove:
- Rows: 1,2, and the Totals at the bottom of the report.
- Columns: Keyword Status, Currency, Status and Max. CPC
Now, let’s sort our data so that we can focus on the keywords that have the most impressions.
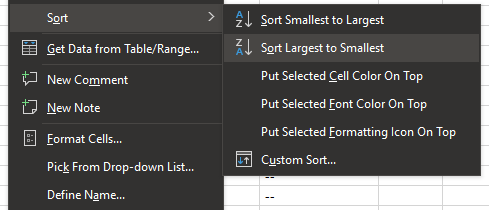
Step 6:
Sort the impressions column from largest to smallest.
Now we’re going to use Conditional Formatting to highlight keywords that are Below average, Average and Above average. Select both the Ad relevance and Landing page exp. columns at the same time. With both columns highlighted:
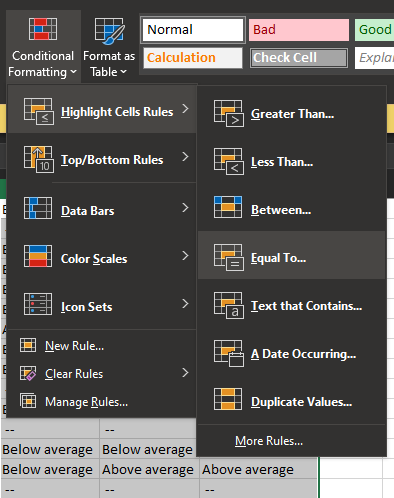
Step 7:
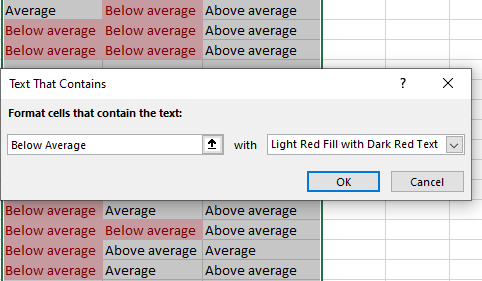
Select Conditional Formatting > Highlight Cell Rules > Equal To.
Type Below average in the available field and select OK to change the fill color of all cells with text equal to Below average to red.
Now, we want to do the same thing for any cells that are equal to Average or Above average, but this time, change the fill color to blue.
Step 8:
Select Conditional Formatting > Highlight Cell Rules > Equal To. Type Average in the available field and select Custom Format from the drop-down menu.
Change the fill color to blue and select OK.
Now, repeat step 8 and change the fill color for all cells that are equal to Above average to blue.
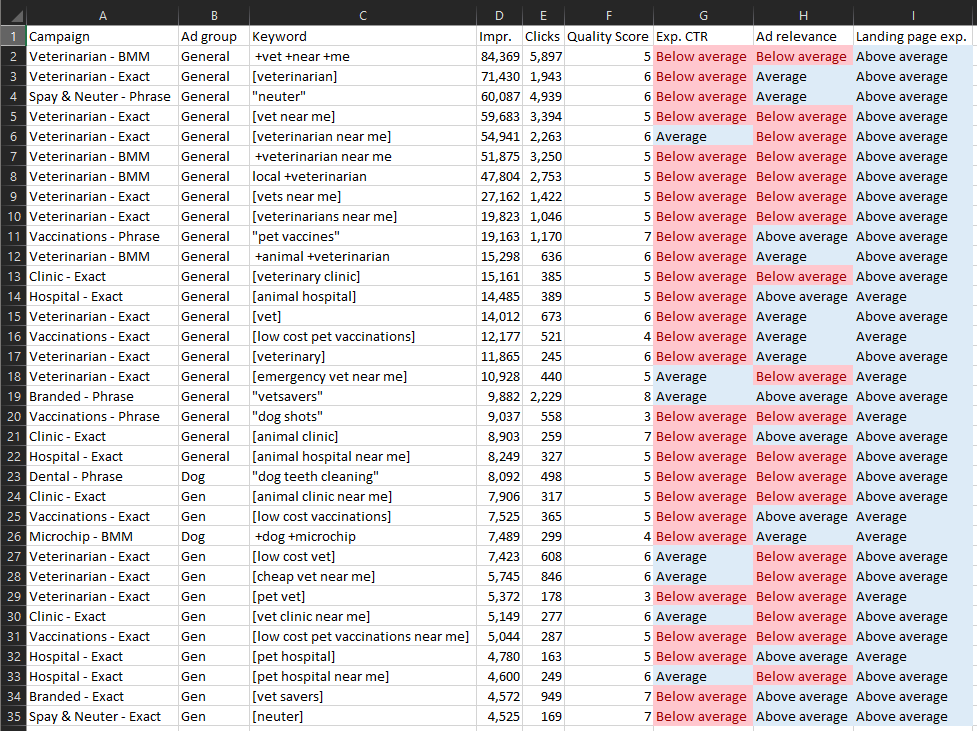
Congratulations! You have finished creating a quality score analysis sheet.
This sheet makes it easy to visually identify which factors are causing low quality scores and where to focus your attention to make improvements. Here’s a few tips on what optimizations you should make in each scenario:
- Exp. CTR is Below average while Ad relevance and Landing page exp. are Average or Above average.
In this scenario you should focus on keyword bids. There may be an opportunity to increase your bids, improve ad position, and get more clicks. - Exp. CTR and Landing page exp. are Average or Above average and Ad relevance is Below average.
In this scenario you should focus on improving ad group structures and ad copy. There should be no more than 10 – 20 keywords in each ad group. The ad copy messaging should closely match and even include the keywords within the ad group. - Exp. CTR and Ad relevance are Average or Above average and Landing page exp. is Below average.
In this scenario the landing page is the problem. Make sure that the landing page content matches the ad copy and keywords you’re targeting. The landing page should be relevant to the users search term.
Quality Score at the Campaign or Ad Group Level
So, what if we want to see quality score at the campaign or ad group level? You can use the same quality score report we just created to aggregate quality score at the campaign or ad group level by using a pivot table.
For this exercise you won’t need to use the Exp. CTR, Ad relevance, or Landing page exp. columns. You don’t need to delete them, just know that we will not be including them in our pivot table.
When we look at quality score at the ad group or campaign level, we need to use weighted quality score. Keywords with more impressions hold more weight and we have to take that into account to get accurate data. The formula for weighted quality score is: (Impressions * QS) / Impressions.
Let’s get started!
Step 1:
Make a new column in your spreadsheet and give the header the title Impr. * QS.
Step 2:
Use a simple Excel multiplication formula to multiply the Impr. column by the Quality Score column.
Step 3:
Drag the cell down to the bottom of the sheet to multiply each Impr. by Quality Score in each row.
Step 4:
Select/highlight all the data. This should include all rows and the following columns:
-
Campaign
-
Ad group
-
Impr.
-
Clicks
-
Quality score
-
Impr. * QS
Select Insert > Pivot Table.
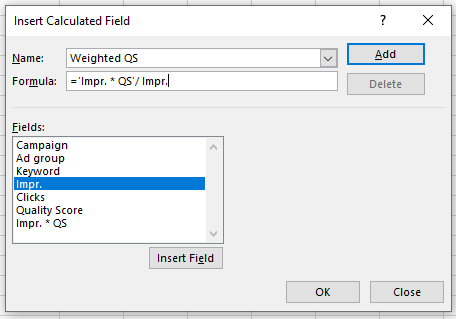
We’ll finish our weighted quality score formula by creating a Calculated Field in the pivot table.
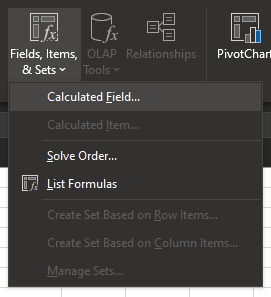
Step 5:
Select Fields, Items & Sets > Calculated Field.
Step 6:
Insert the following formula to create the weighted quality score metric and click OK.
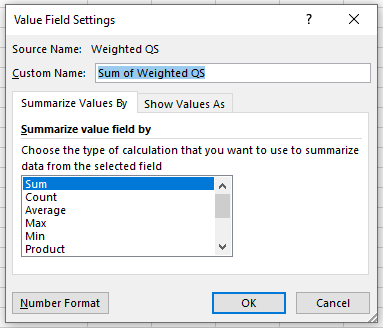
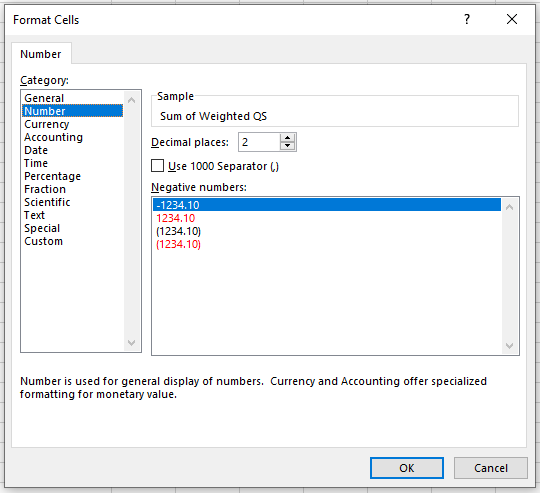
Step 7:
Right click on Weighted QS and change the Value Field Settings to a number with 1 or 2 decimal places.
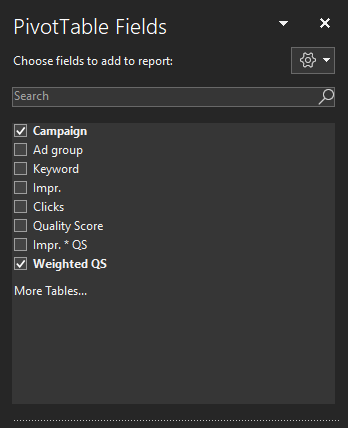
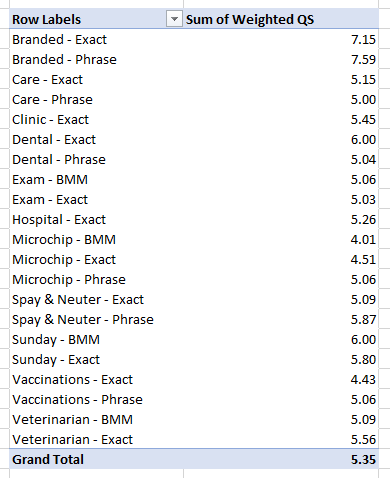
Step 8:
Select Campaign or Ad Group in the Pivot Table Fields.
That’s it! You can now select either campaign or ad group to see quality score for each campaign and ad group.
Putting these techniques into practice should give you a solid foundation for understanding quality score issues and what steps to take to optimize. Contact us today to connect with our team of Paid Ad experts!


